Keeping track of the books you’ve read, books you want to add to your personal library’s growing collection, and books that you want to read in the future are important tasks for every reader and book hobbyist. GoodReads has long been the go-to platform for all this and more, but there’s an alternative website to organize books you’ve read that’s gaining traction: StoryGraph.
At the beginning of 2022, I started making the switch from GoodReads to StoryGraph. In this post, I’ll share tips on how to use StoryGraph to manage your TBR, track your reading goals, write reviews, and view your reading stats.
How to Add a Book to Your TBR in StoryGraph
Getting started with StoryGraph is pretty easy. You can download the app on your phone or tablet, or set up your account on the website using your computer. Once you’ve created your account, you’ll have the option to migrate your data from GoodReads if you want to switch from GoodReads to StoryGraph.
This feature can be a bit hit or miss, but even if it only imports some of your GoodReads data, it will speed up the process of getting your StoryGraph account up and running.
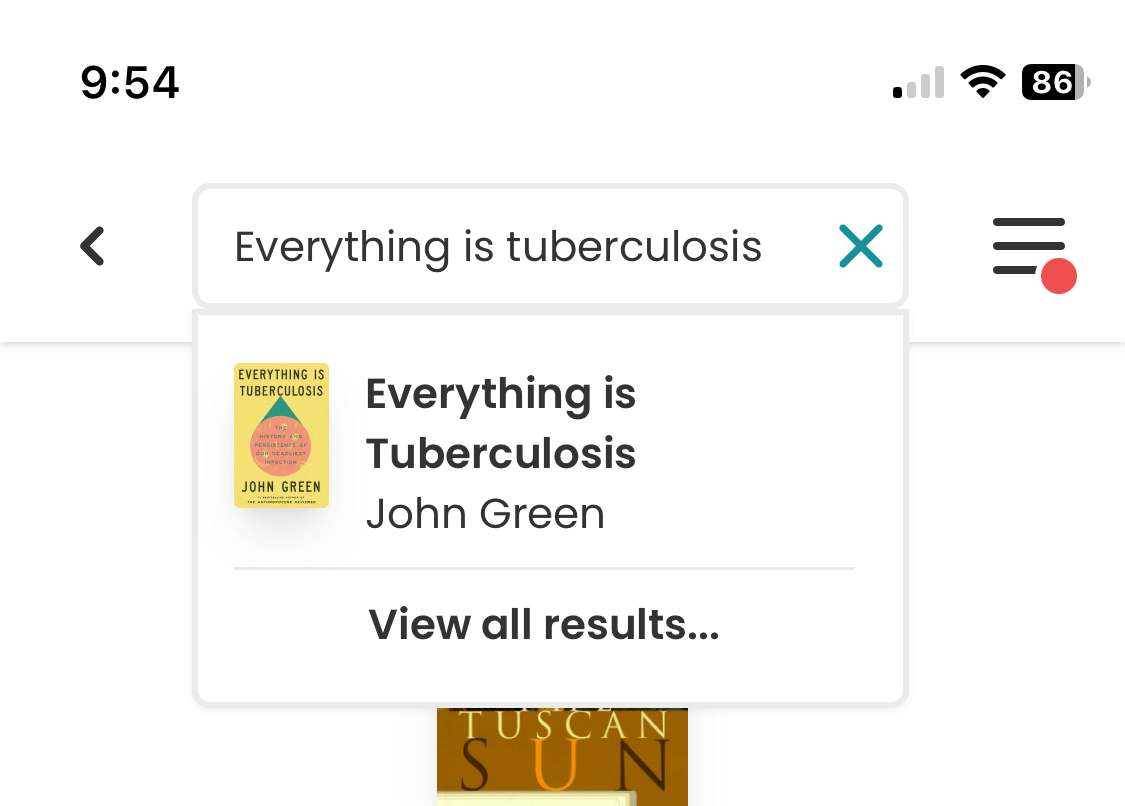
After you’ve finished setting up your account, you can start adding books to your TBR (To Be Read) pile. Just search any title or author using the search bar:
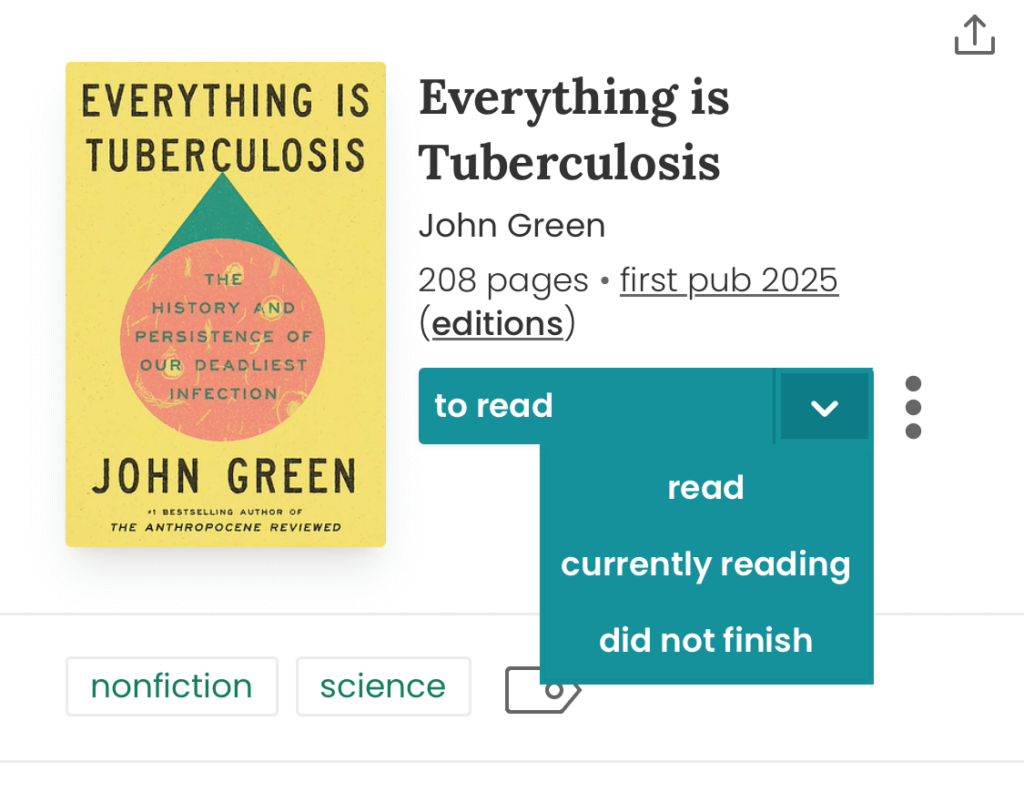
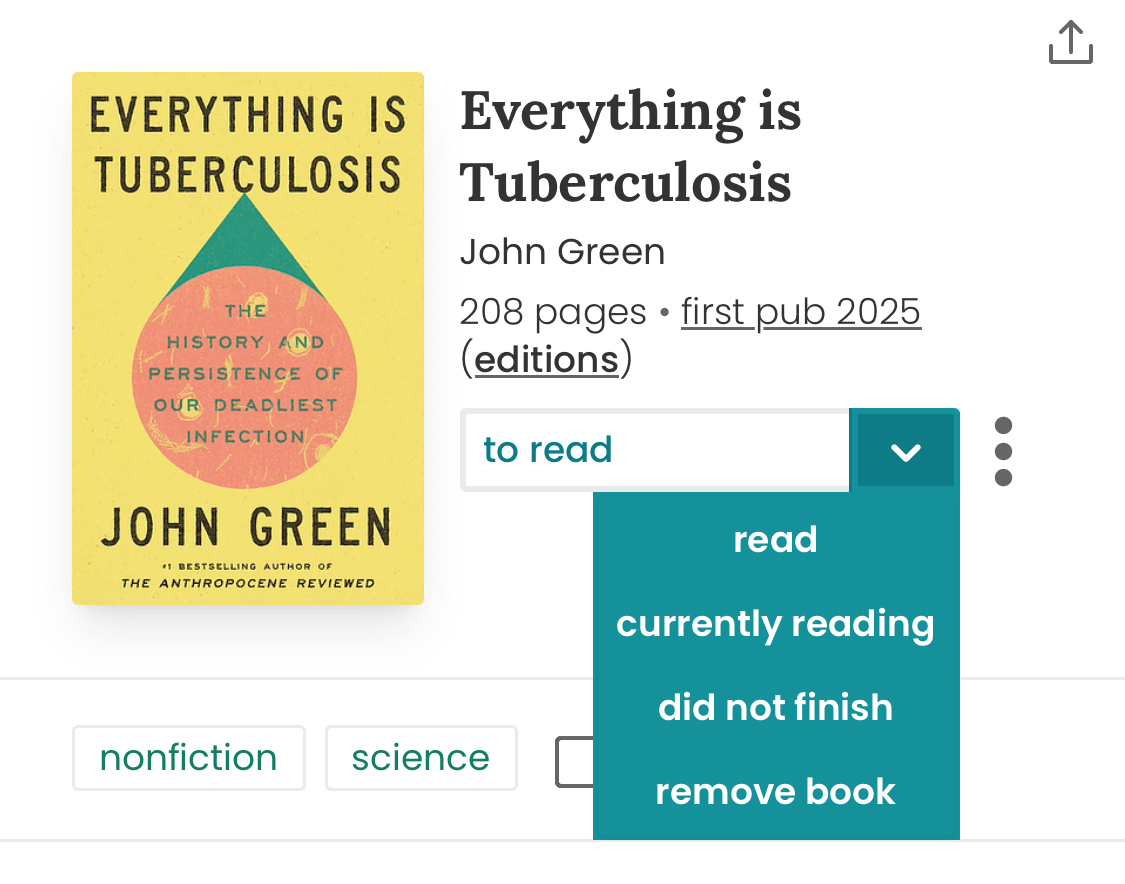
Then set the status for the book you’re interested in as to read using the dropdown:
StoryGraph will then add the book to your TBR pile. You can find this on the home screen of the app. Tap the right arrow to view all the books you’ve saved:
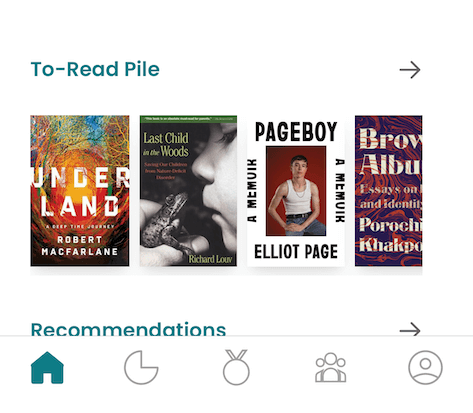
From here you can see all the books you’d like to read, making it a great tool for deciding what to read next.
How to Mark a Book as “Read” in StoryGraph
To track which books you’ve read, you simply need to change the status to read using the same dropdown shown above:
If you’re tracking a reading goal or want to be able to see your reading stats for the year, make sure to set the date you read the book as well. Just scroll down and use the dropdowns to set the date, or tap Set to today to use the current date:
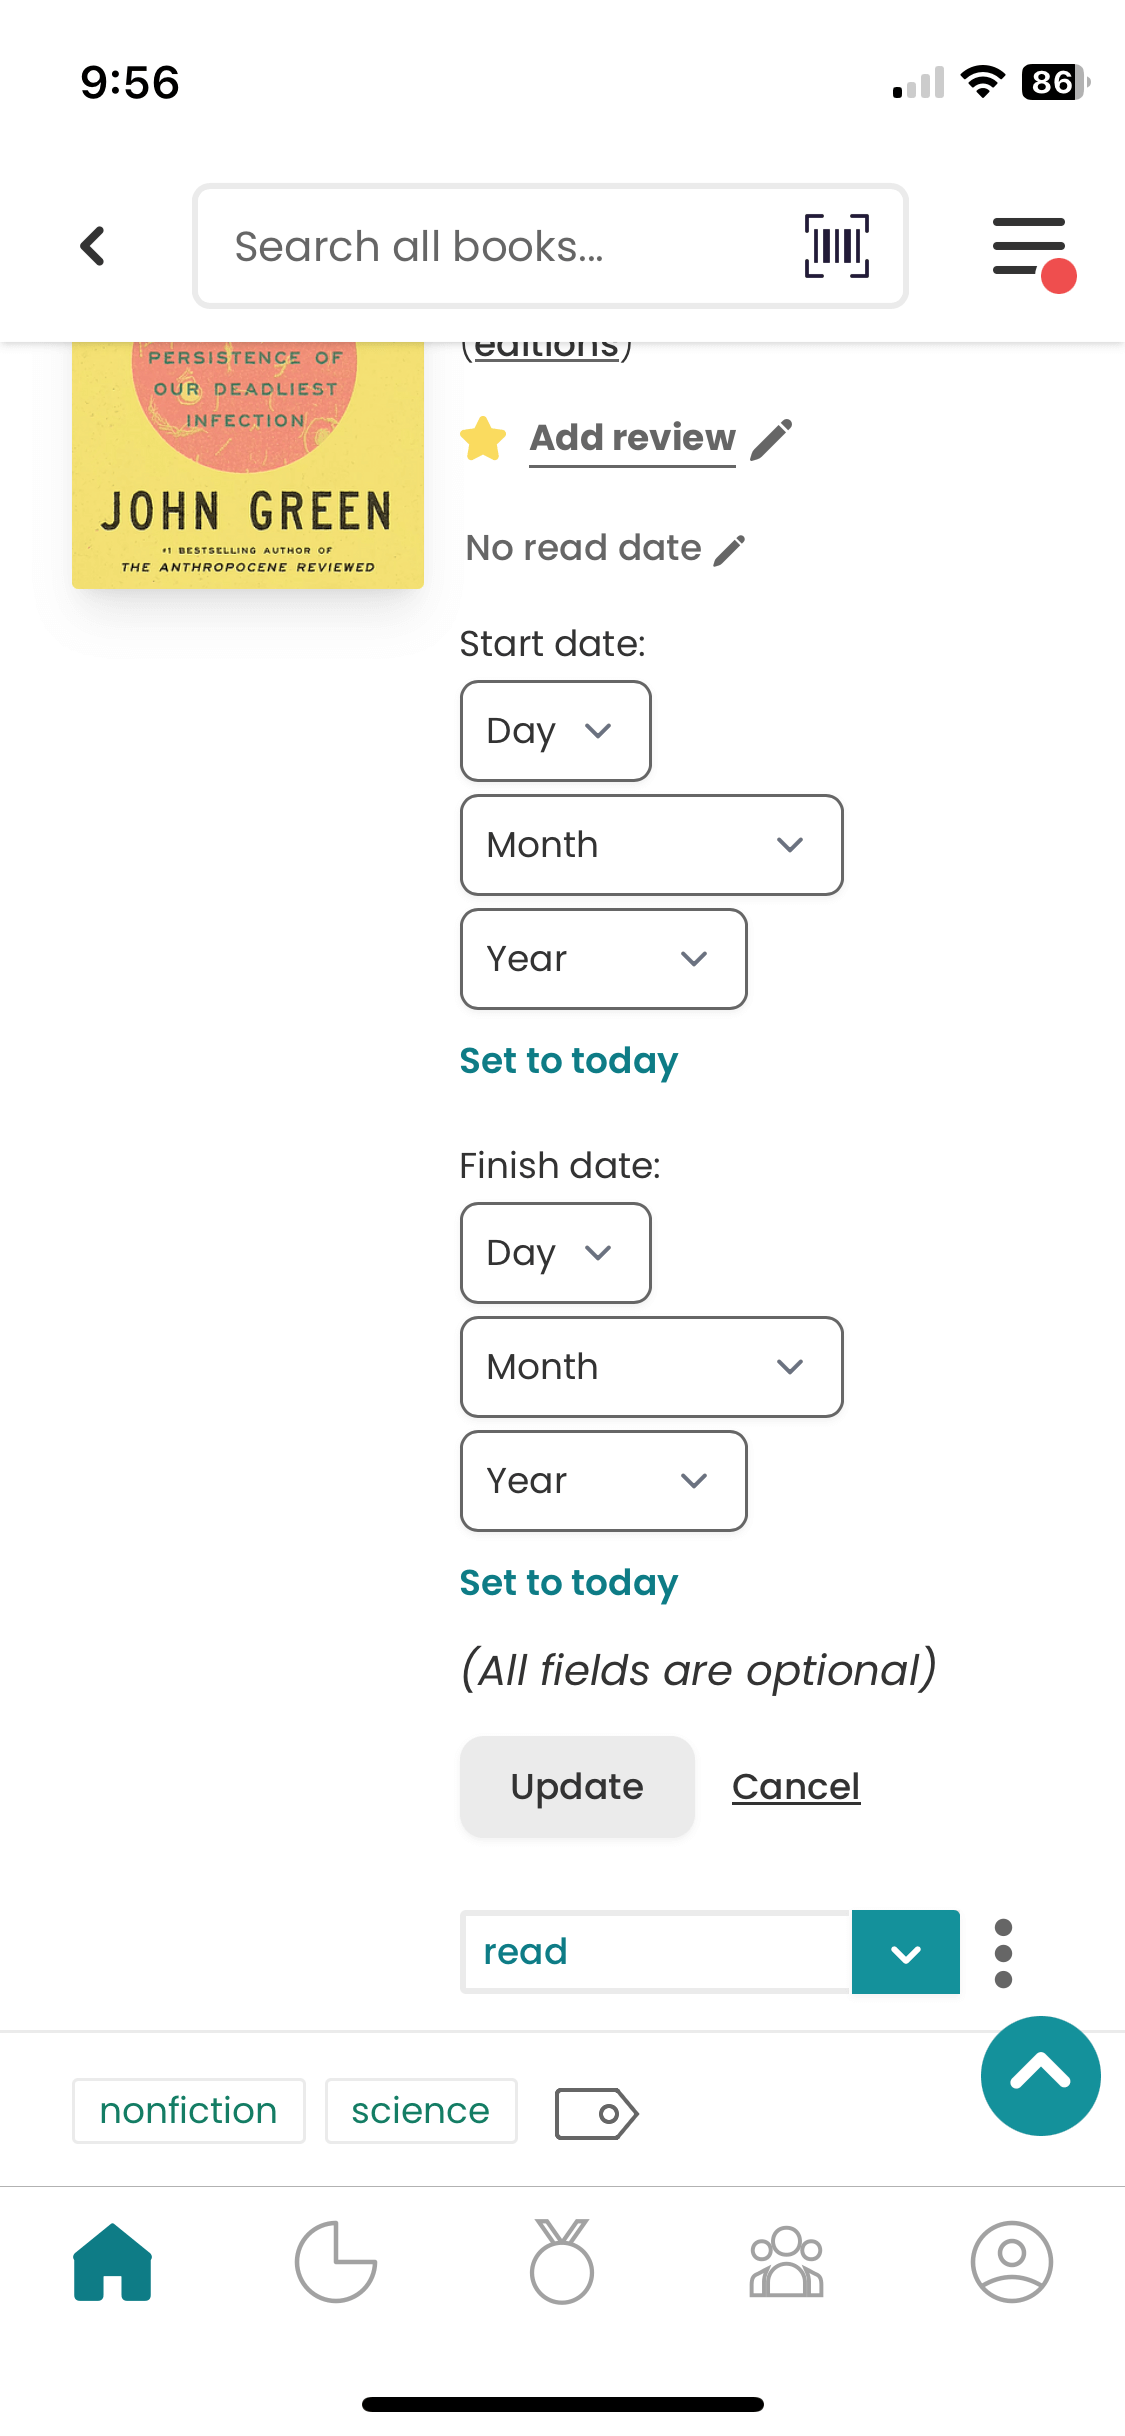
Pro Tip: If you track your start dates as well as your finish dates in StoryGraph, you’ll be able to see the average amount of time it takes you to finish a book in your reading stats.
Then tap Update to save your reading date. If you ever want to make changes, tap View/edit read history to reveal more settings.
How to Write a StoryGraph Review
Like GoodReads, StoryGraph lets you add reviews for the books you’ve read. These can be nice to look back on if you want to reminisce about your favorite books, but more importantly, they help other readers decide what they want to read next.
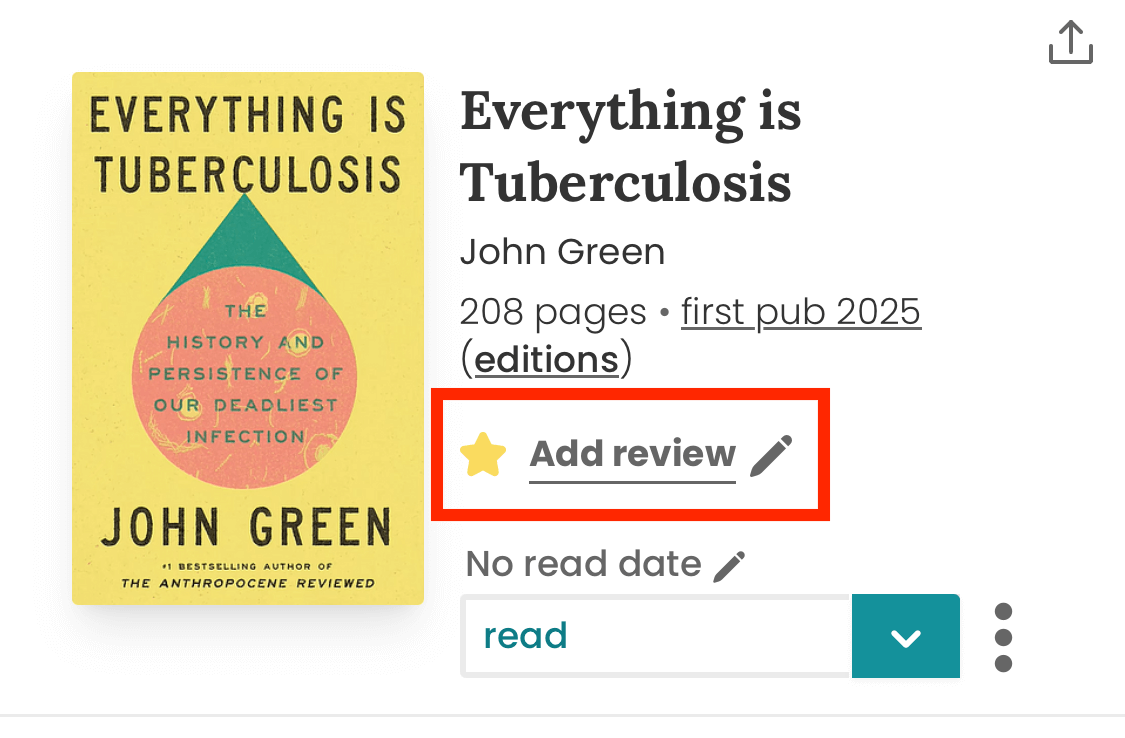
To add a review, tap Add review on the book’s page:
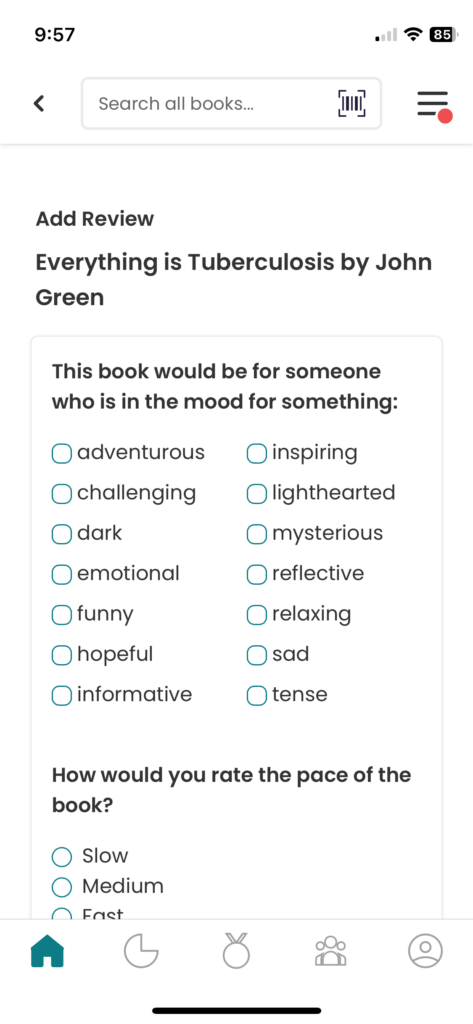
StoryGraph asks you several questions about the book, such as how you’d describe its mood, what the pacing is like, if the story is more plot or character driven, and what you thought about the characters:
Then you’ll have the chance to give a star rating (zero to five stars, in quarter-star increments) and write a detailed review with all your thoughts about the book. You can also add a list of the themes, tropes, or topics the book covers:
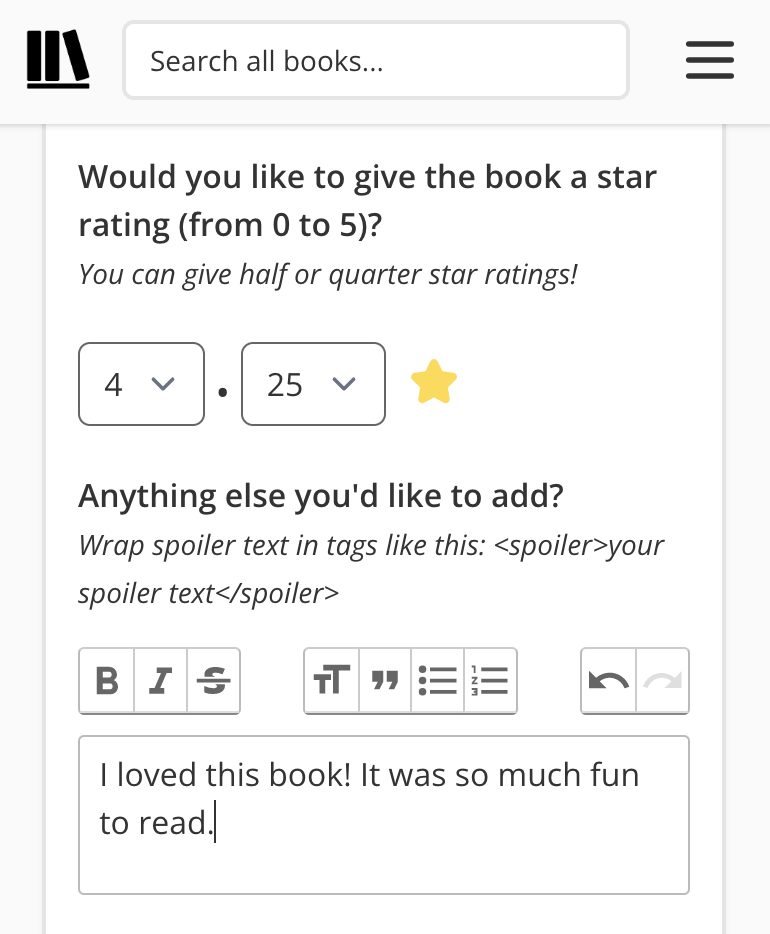
Make sure to tap Save when you’re done.
StoryGraph Content Warnings
StoryGraph also includes a section for content warnings on the review screen. These help readers who might be sensitive to certain topics avoid books that might be harmful to their mental health, or that they just want don’t want to read:
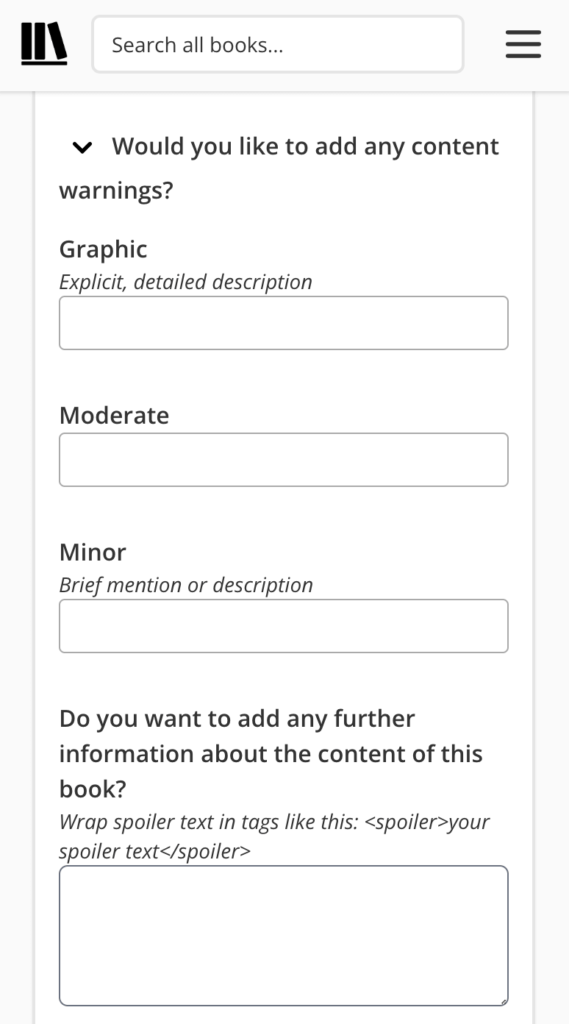
If you found something in the book you’re reviewing that you think might bother other readers, it’s nice to include that here. Contributing content warnings is part of being a good member of the literary community.
How to See All the Books You’ve Read in StoryGraph
If you want to see the books you’ve marked as Read for a specific time period, I recommend using the Reading Stats section of the app, which I’ve explained below.
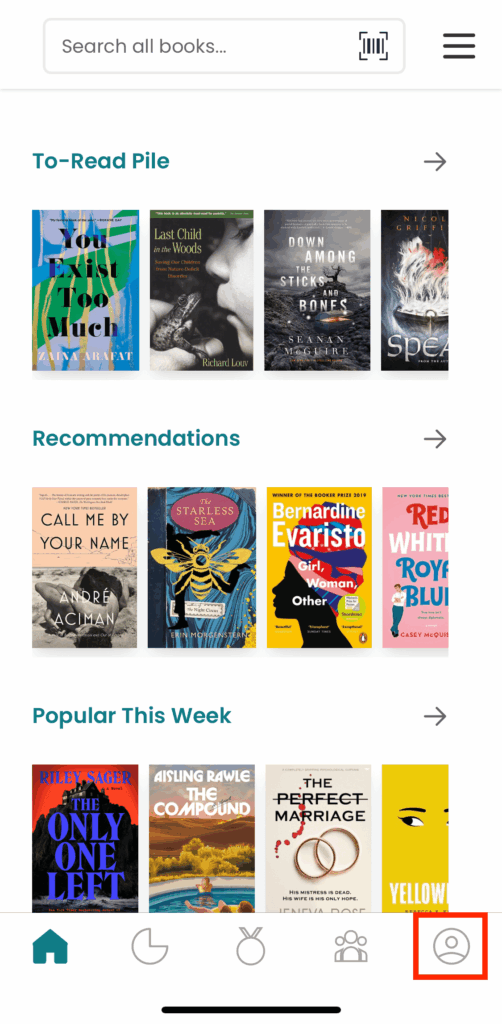
To see all the books you’ve read in StoryGraph, regardless of when you read them, navigate to your profile. It’s the icon at the bottom of the screen that looks like a person.
Then scroll to the Recently Read section and tap the arrow:
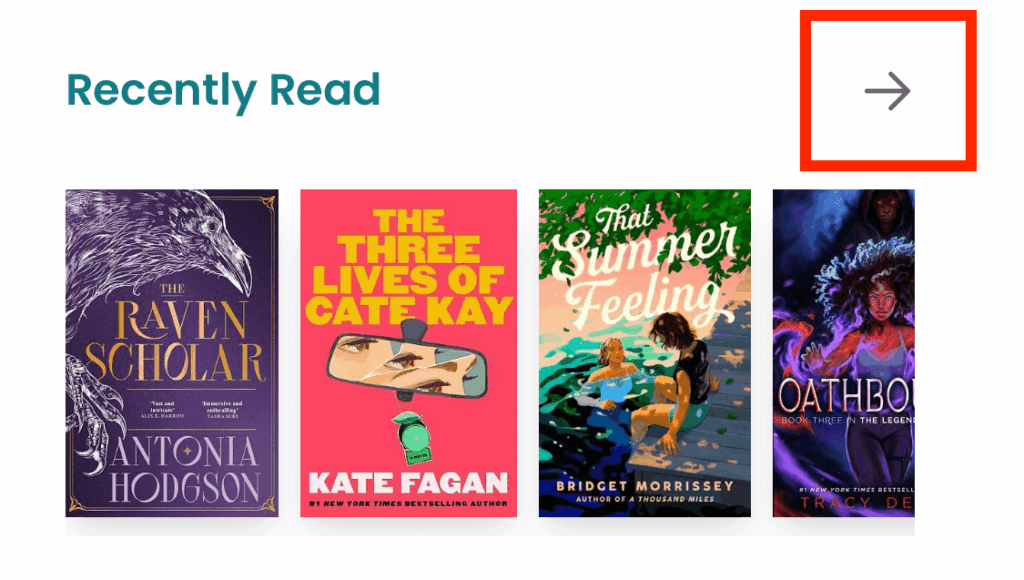
This will take you to your Read Books page, where you can see all the books you’ve marked as Read in StoryGraph.
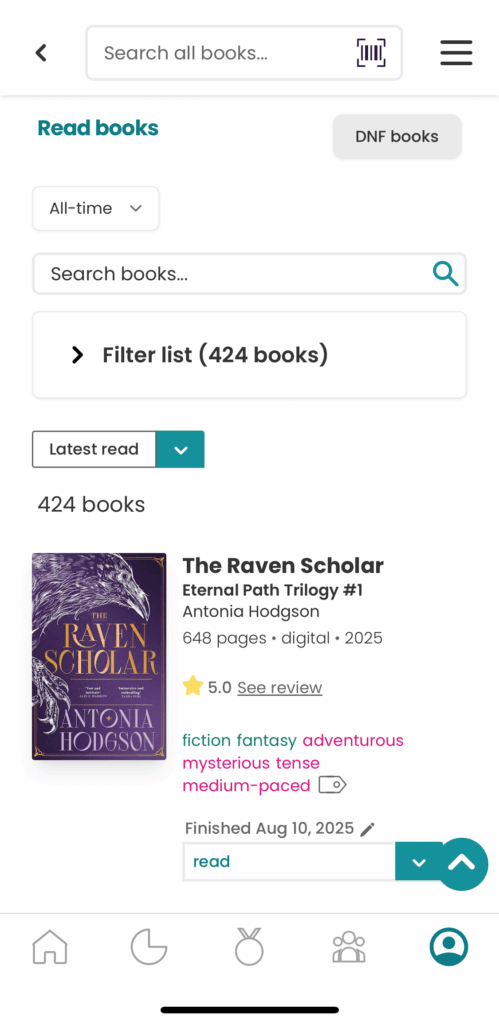
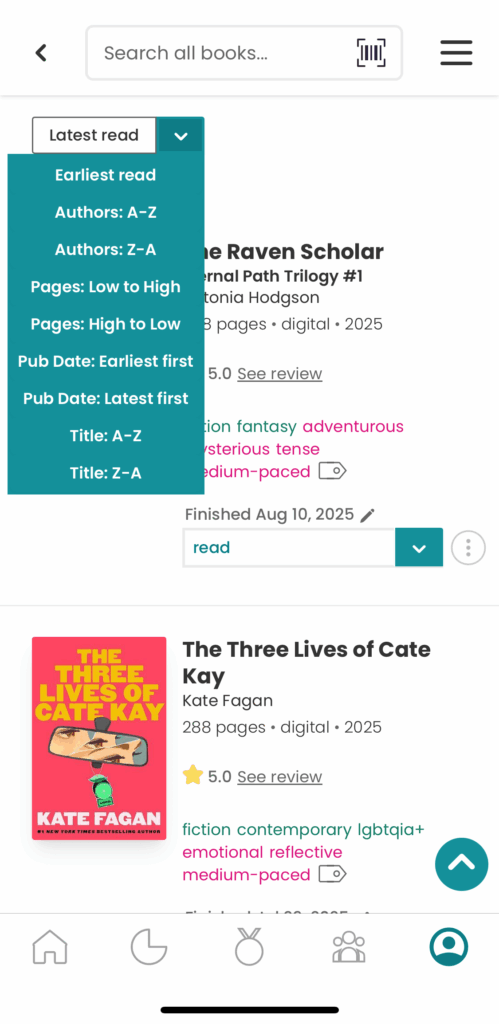
By default, your most recently read books will be at the top, and your books with no reading date will be at the bottom. You can use the dropdown near the top of the screen to sort by earliest read, alphabetically by author, alphabetically by title, number of pages, or publication date.
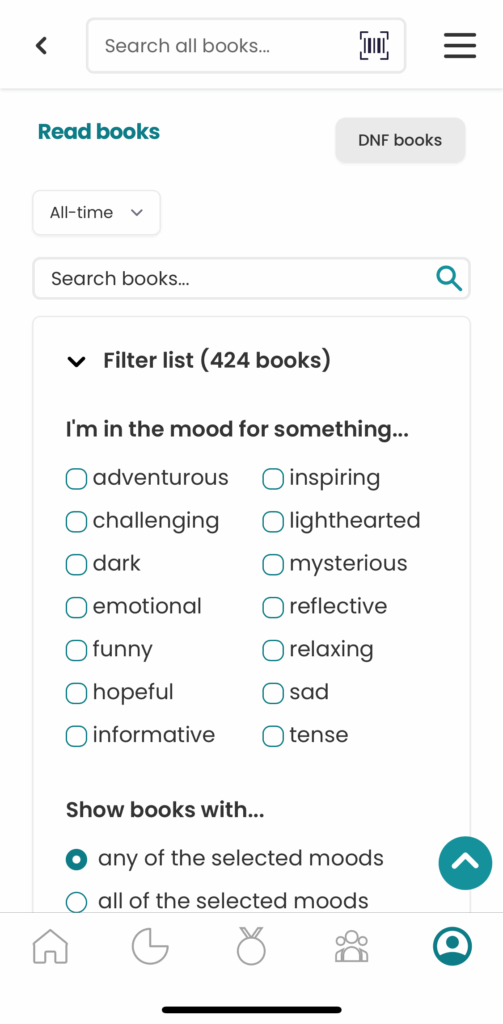
You can also set a time period to see books read in a certain year, search your read books for a specific title or author, or filter your read books by mood, pace, genre, length, format, publication date, or whether or not you own them.
How to See All the Books You Own in StoryGraph
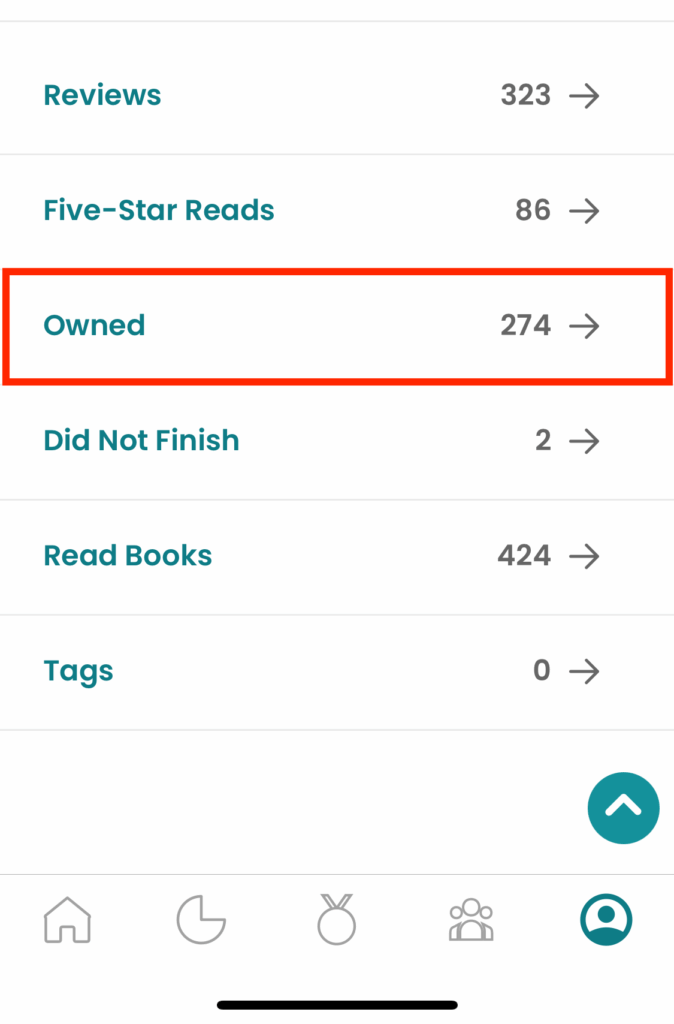
Another helpful feature is the Owned Books list. You can access it by again going to your profile in the StoryGraph app and scrolling down to the Owned section:
StoryGraph includes a search bar and several filters you can use to navigate through all the books you’ve marked as Owned. You can also you the dropdown near the top of the screen to sort your books by when you acquired them, alphabetically by author or title, length, or publication date, just like for books you’ve read.
Being able to see all the books you’ve read in StoryGraph and the option to create a list of all the books you own are super helpful for tracking your reading progress through time and managing your personal library.
How to View Your StoryGraph Reading Stats
Last but not least, one of the best features of StoryGraph is the reading stats it provides. You can see your reading habits broken down into detailed charts and graphs, something that GoodReads doesn’t offer.
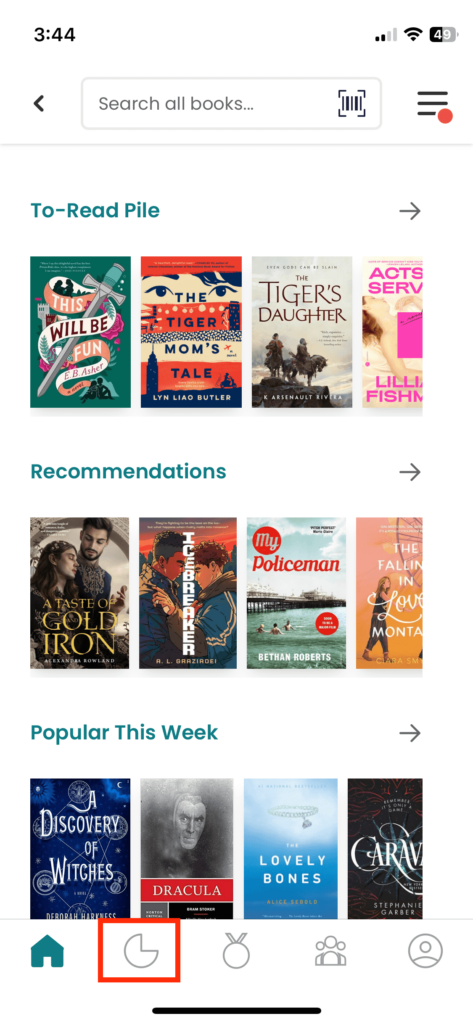
To view your reading stats, tap the Stats tab (shaped like a pie chart).
You can then change the date range you want to view. By default, you’ll see all your data for the current year.
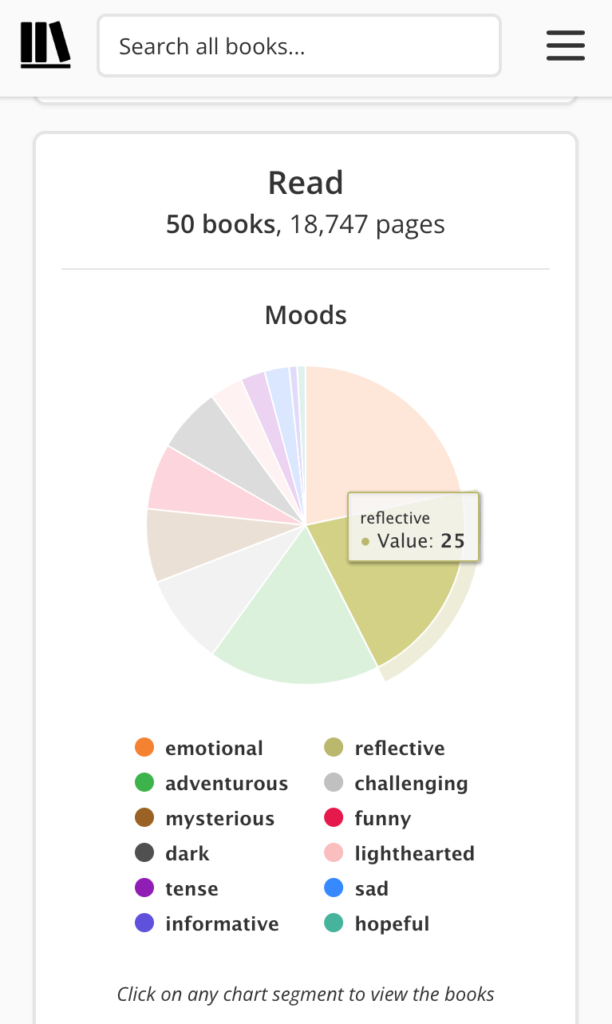
Then you’ll see charts that show you:
- A breakdown of the moods of the books you’ve read
- A breakdown of the pacing of the books you’ve read
- A comparison of the length of the books you’ve read by page number
- A comparison of the genre of the books you’ve read
- What formats you read in (print, digital, or audio books)
- Your most-read authors
- What languages you read in
- The total number of books and pages you’re read
- Your average star rating and a breakdown of the star ratings you’ve given
The charts are also clickable. You can select a bar, segment, or point to view all the books that fall under that distinction.
Remember, in order for books to be included in your stats, you have to add the dates you read them.
If you’re looking for a website to organize books you’ve read and don’t want to use GoodReads, StoryGraph is a great solution. It’s easy to use and provides tons of cool features. I’ve just scratched the surface in this post. There’s a lot more you can do with this app, including viewing personalized reading recommendations and tracking your reading goals.
Want to see more posts like this one? Make sure to sign up for my monthly newsletter and follow me on Instagram!
Leave a Reply